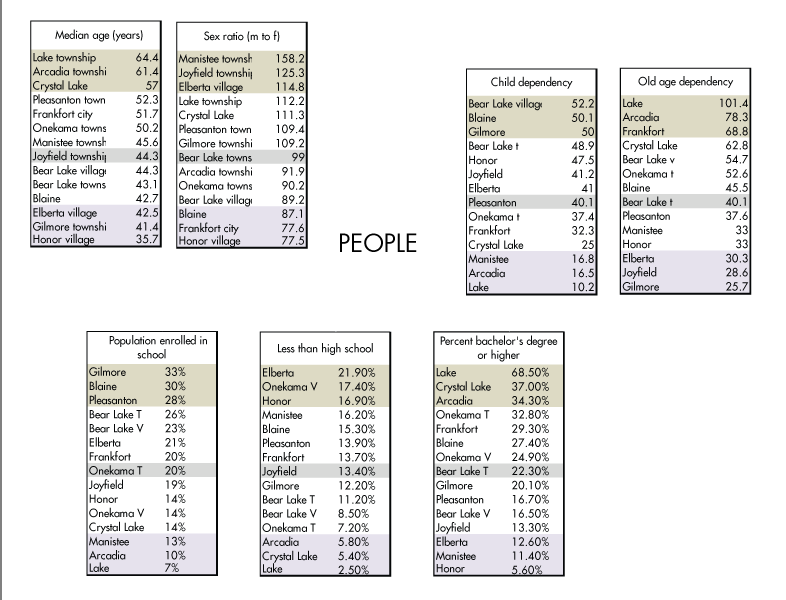
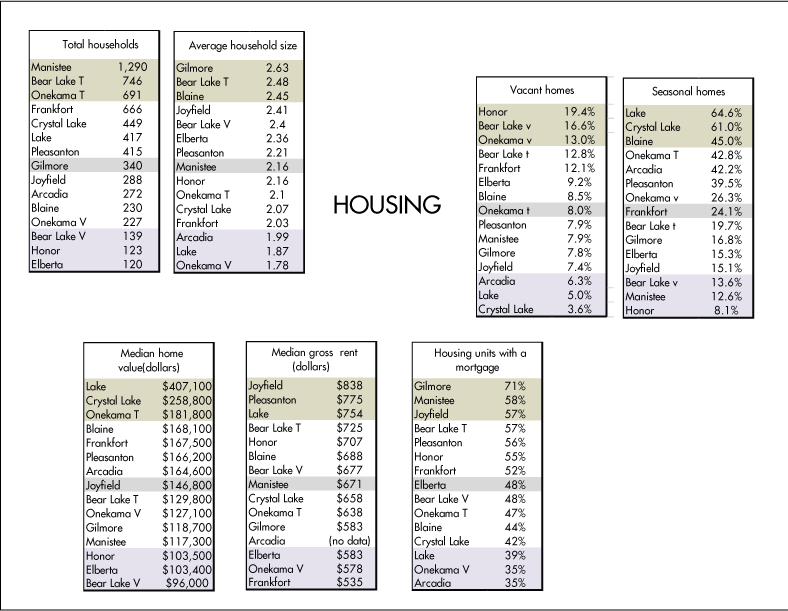
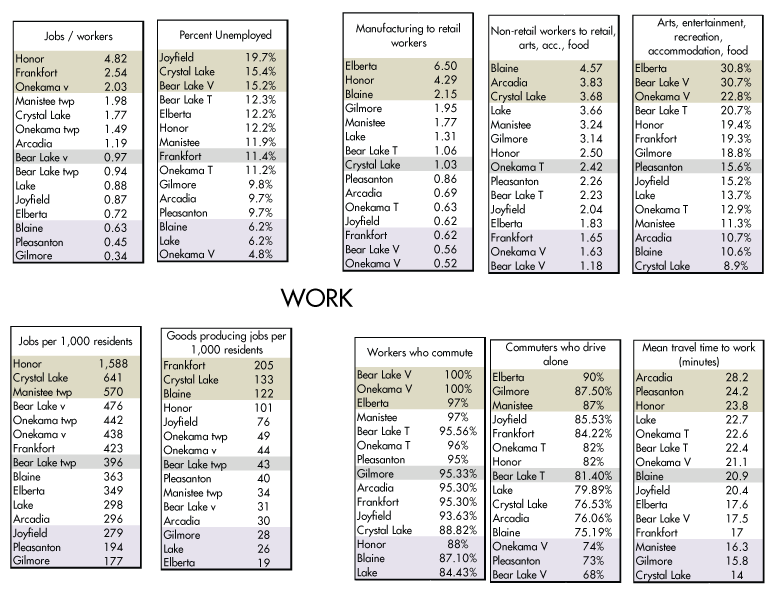
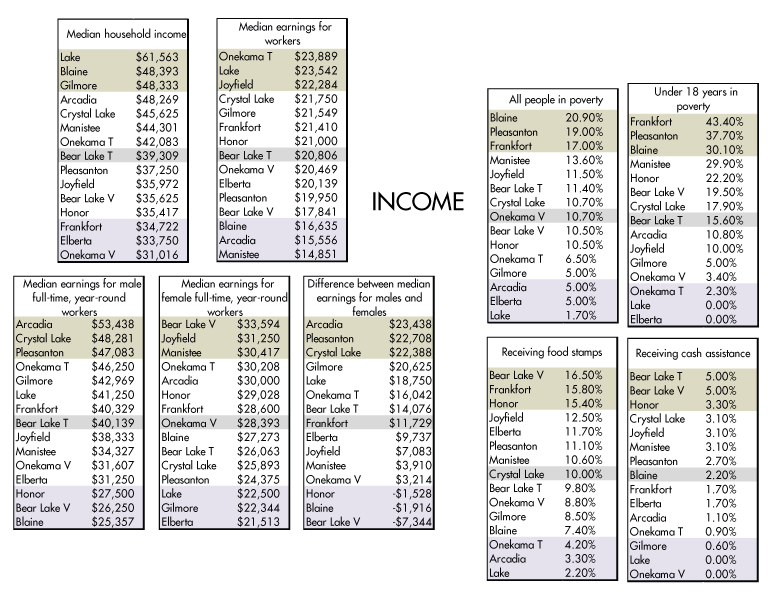
There is an astonishing amount of data involved in producing a master plan. And TEN master plans? Spreadsheet city! We’ve been mining the US Census, ESRI business reports, MDOT traffic counts, and any other data trove we can get our hands on to paint the fullest picture possible of the Lakes to Land region and each of its unique communities. After assembling standardized datasets for each community, one handy tool we used to get a handle on it all was a VERY LONG spreadsheet containing each benchmark we looked at, with all communities compiled and sorted in order of decreasing value. It helped illuminate areas of special interest for each community (that’s why the top three, bottom three, and median values are highlighted) and also to identify areas of similarity or common interest between communities. It has been such a fun and informative tool that we thought you might enjoy it too!
For ease of presentation, we broke the chart up into four categories: People, Housing, Work, and Income. (It’s a working tool, so formatting is…hasty in a couple of places.) Clicking on any of the images below will bring up a larger size, or you can click here for a .pdf with all four pages. Think nothing beats the real thing, in all its spreadsheety glory? Us too! Click here to download it.
- Community Demographic Rankings: WORK


Thank you for this! Is it safe to say that this data represents information gathered from 2010 and/or since?
Yes! The bulk of the data comes from either the 2010 US Census, or from the 2006-2010 American Community Survey. Data in the few categories which are not from those sources, such as number of jobs per community, come from the proprietary software company ESRI and are dated 2010 or later.
Please post a legend to define/assist with data interpretation of the statistics.
THAT is a good question. There isn’t a legend per se, because each of the categories is in different “units,” but I definitely agree that some are clearer than others. Here are a couple of guidelines and explanations:
Percentages are probably pretty obvious, but I think they all work if you read it as “[Number] of [community] members [category]”. So under “Less than high school,” for example, we could read “2.5% of Lake Township residents have less than a high school education,” or under “seasonal homes,” we could read “8.1% of Honor’s housing is seasonal homes.”
Categories with “to” in it can be read as a ratio. “Sex Ratio (m to f)” is expressing “[number of males] divided by [number of females]”; “Manufacturing to retail workers” translates as “[number of workers in the manufacturing field] / [number of workers in the retail field].”
The formula for child dependency is [number of persons aged 0-14] divided by [number of persons aged 15-64]. The formula for old age dependency is [number of persons aged 65 and over] / [number of persons aged 15-64].
The units for “average household size” is “persons per household.”
The units for “arts, entertainment recreation, accommodation, food services” is “workers.” Example: “8.9% of Crystal Lake Township’s workers are employed in art, entertainment, etc.”
The “Difference between median earnings…” chart refers to full-time, year-round earnings as shown in the adjacent charts.
I hope this is helpful – please feel free to comment again here or to email me on the “Contact Us” page for more!
So there are 158 males to every 1 female in Manistee? Or should that be more like 1.58 males to every 1 female (that sounds more accurate to me). Thanks!
Yes, that’s correct. Thanks!
For those of us who have older versions of Excel, is it possible you could re-upload the file as a .xls file (right now you have only the .xlsx file and I wasn’t able to open that). Thanks!
Hi, Aubrey! Here is an .xls file: Rankings–ALL.xls
PS: My apologies to both of you for the delay in reply – I was out of the office for a couple of days. Double thanks for your patience! ~ Leah